Interpreting spirometry
Spirometry results present airflow as a function of volume and are recorded as flow–volume loops (see Flow–volume loop patterns). Some older spirometers present results as expired volume against time (ie a spirogram).
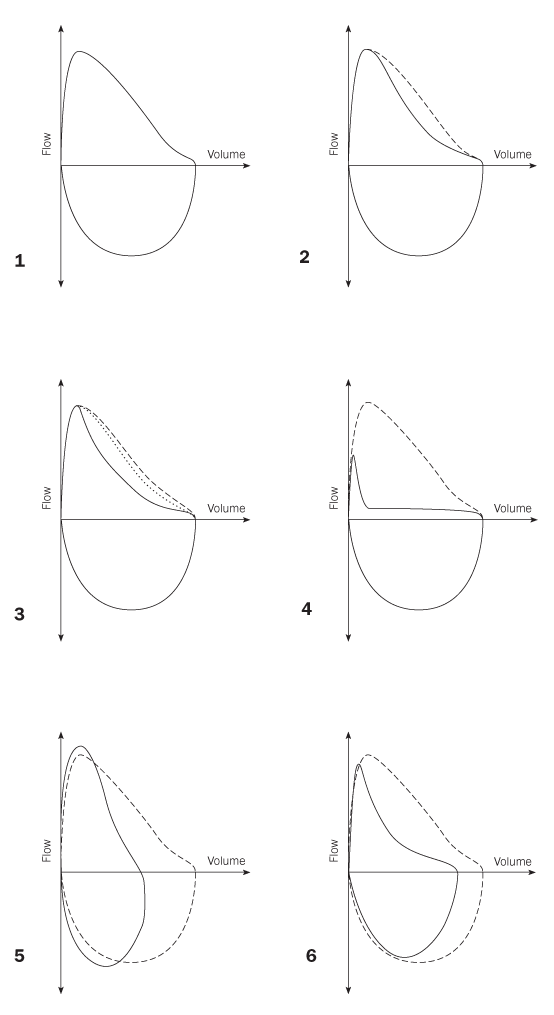
Dashed line on images 2 to 6 represent a normal young adult.
1. normal young adult
2. normal older person
3. airway obstruction with almost complete reversibility; dotted line is postbronchodilator
4. significant airflow obstruction
5. restriction
6. obstruction with reduced forced vital capacity (FVC) due to gas trapping, or mixed obstructive/restrictive pattern
Reproduced with permission from: Borg BM, Thompson BR, O'Hehir RE. Interpreting lung function tests: a step-by-step guide. West Sussex, UK: John Wiley & Sons, Ltd; 2014
Spirometry parameters for an individual are compared with reference values matched for age, sex, height and ethnicity. Spirometers allow for programming of reference values in the software, and results are automatically calculated based on the programmed reference value set.
|
Obstructive ventilatory defect |
Restrictive ventilatory defect | |
|---|---|---|
|
spirometry findings [NB2] |
low FEV1/FVC ratio concave flow–volume loop |
low FVC normal or increased FEV1/FVC ratio flow–volume loop shows small volume |
|
examples |
asthma, COPD, asthma–COPD overlap |
ILD, respiratory muscle weakness, restrictive chest wall disease (eg kyphoscoliosis), rib deformity, obesity |
Note:
COPD = chronic obstructive pulmonary disease; FEV1 = forced expiratory volume in 1 second; FVC = forced vital capacity; ILD = interstitial lung disease NB1: For more information on identifying ventilatory defects on spirometry, see the National Asthma Council Spirometry Handbook . NB2: Normal ranges for FEV1 and FVC depend on the spirometer’s programmed reference value set. | ||